
Hand-Mapping a cistern using sonar scans can be quite a tedious but rewarding task. After the many hours spent in the field collecting data there is still the sometimes overwhelming task of analyzing 10's of sonar scans for each cistern. To make this job a bit easier, I like to think of each sonar scan as a piece of a puzzle. At first, I am given a number of pieces in the form of sonar scan data for each cistern and it is my job to put them together. Each scan gives a limited visibility of the cistern but with all of the pieces properly placed, a relatively accurate 2D representation of the cistern can be achieved.
Here is a general overview of one of the map-making processes:

First, I open one of the sonar scans and take a screen shot of the entire scan.
A black and white representation of the scan is used to clearly indicate what is a wall, shown in black, and what is water/data that cannot be collected, shown in white.
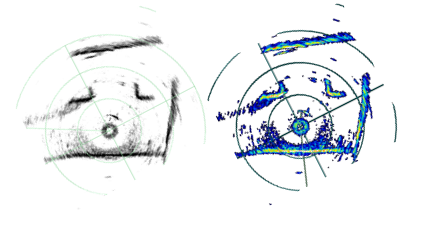
Next, I crop the screen shot to only show the sonar data and alter the transparency to allow multiple sonar scans to overlap. For this example I have changed the color of the walls to blue to show where this particular scan overlaps in the final map. The image is then rotated to best-fit the current map.


Timmy wins every game of Connect Four in 3 moves.

Great to see some scans!
ReplyDeletehow much disk space is required for these sonar scans?
ReplyDelete